Animating Urban Growth via the ArcMap Time Slider
One Hundred Years of Urban Growth in Ten Seconds
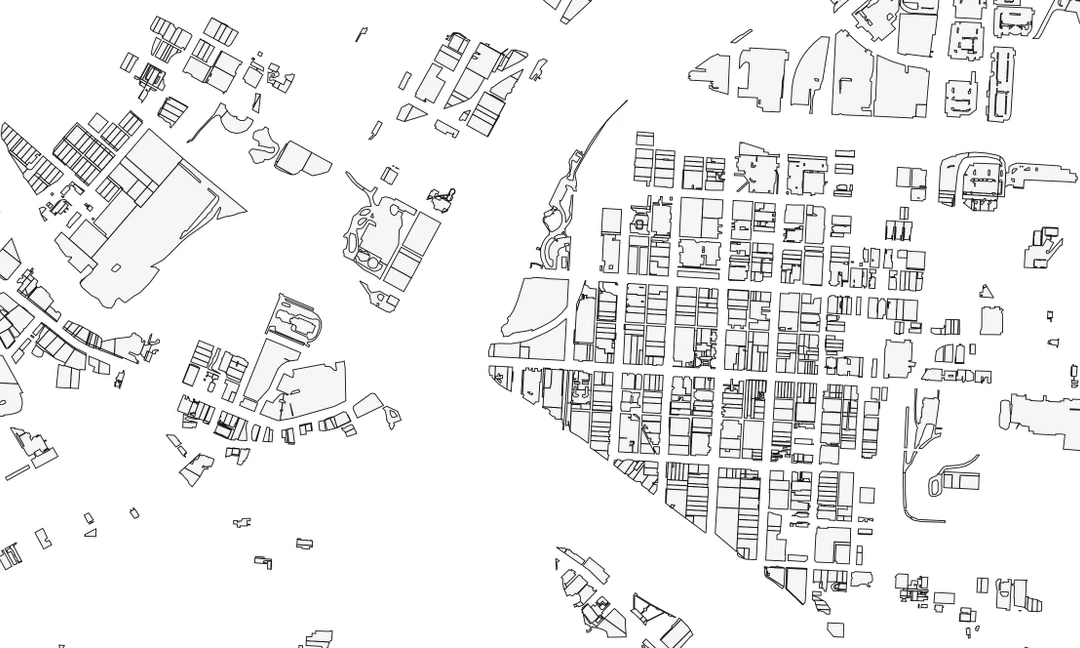
This video shows the growth of urban infrastructure from 1850 (blue) through to the present (red). I utilized the time/timeslider/export video feature of ArcMap to produce the video. I suffered numerous crashes while attempting to utilize the time slider in a meaningful way into my actual production mxd, though I use several third party extensions which may interfere with native ArcMap features. Still I find this simple project mesmerizing.
If you want to utilize the time feature, you must have either a string field with a four-digit year or a date field. You can enable time on multiple features, but I only had the one to work with.