getBounds
Archive
Connect
Resume
Blog
Posted October 15, 2025
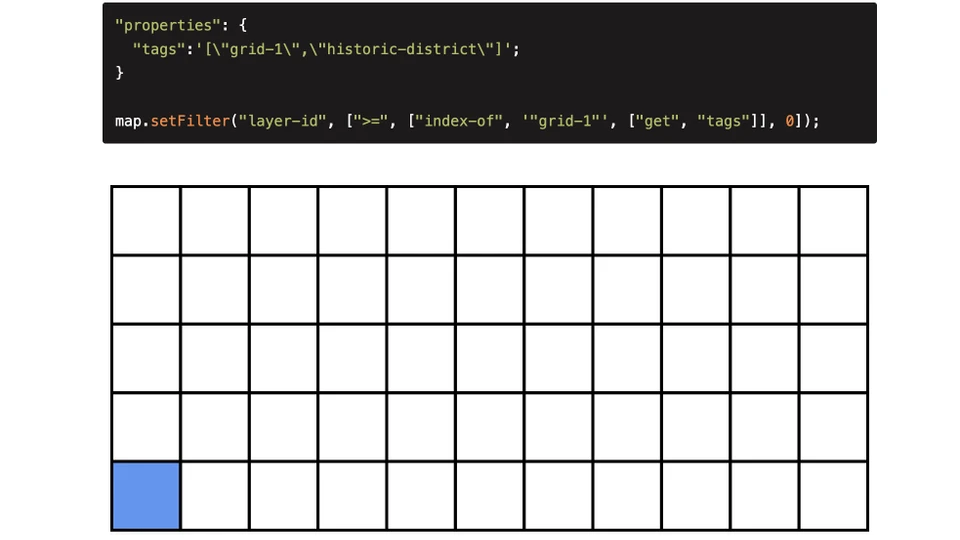
Filtering Arrays in MapLibre
Techniques for Substring Matching in MapLibre GL JS and Mapbox GL JS
Posted January 17, 2025
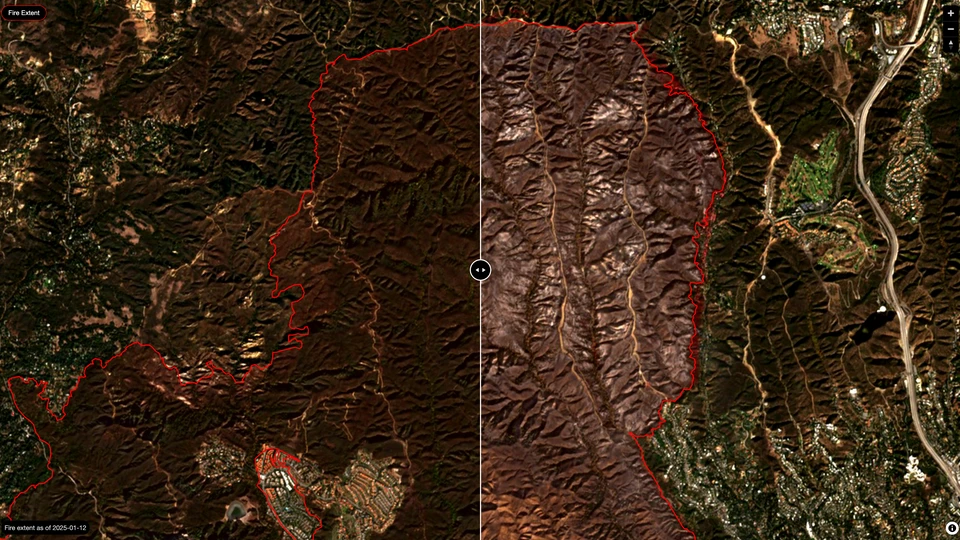
Palisades Fire Before and After
A Sample of Available Satellite Data for Post-Disaster Visual Assessment
Posted November 4, 2024
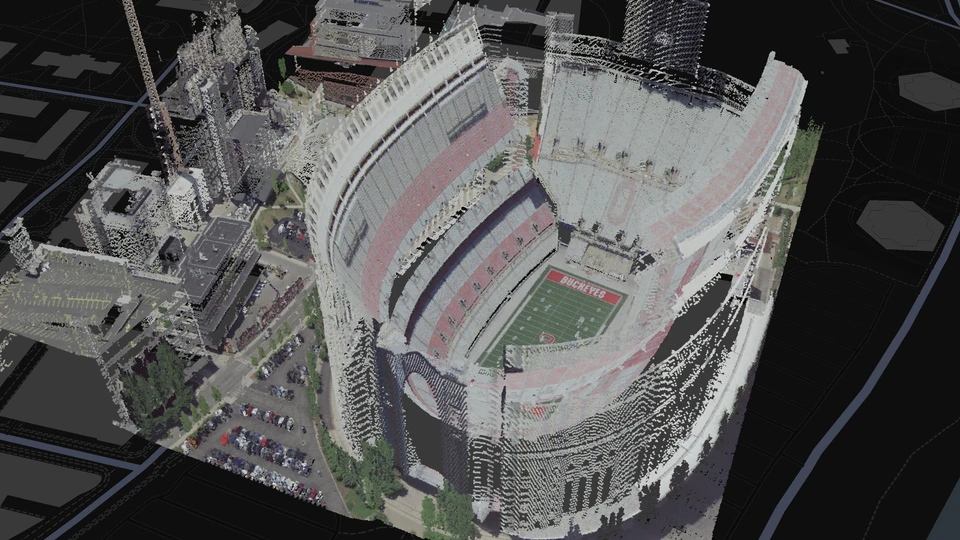
Deck GL and 3D Tiles
Generate Colorized 3D Tiles from LiDAR and Ortho Imagery
Posted December 24, 2023
Finding Perpendicular lines with TurfJS
Bearing, LineIntersect & Destination
Posted August 18, 2023
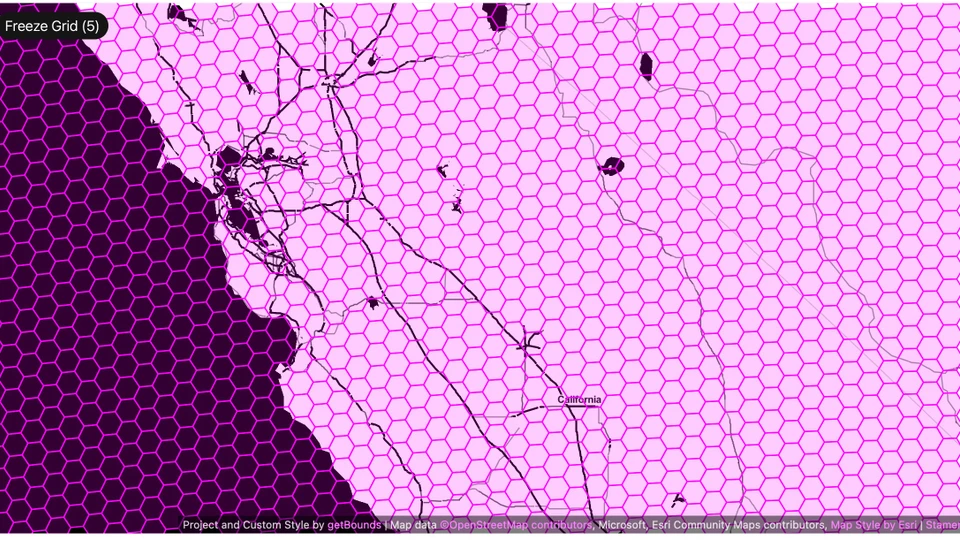
H3 Grids Explorer
A Web Tool for Exoploring H3 & Geohash Grids
Posted January 29, 2022
| Updated January 4, 2024
Export GeoJSON from PostgreSQL using Beekeeper Studio
Query > Download > Copy > Paste!
Posted September 16, 2021
FOSS4G Image Processing
Creating Cloud Optimized GeoTIFFs and Raster Tiles using GDAL and QGIS
Posted September 2, 2021
| Updated November 26, 2023
Generating Cloud Optimized GeoTIFFs and Raster Tiles with GDAL
TL;DR gdalbuildvrt, gdal_translate, gdal_warp and gdaladdo
Posted September 21, 2020
From the Ashes of Shapefiles
A Presentation for the 2020 Virtual Ohio GIS Conference
Posted September 20, 2020
GIS and Remote Work
An Exploration of a GIS Remote Work Toolkit
Posted April 27, 2020
| Updated September 18, 2023
Exporting AGOL Feature Services to GeoJSON
Using NodeJS and Batches to Transform an ArcGIS Online Feature Service to GeoJSON
Posted April 1, 2020
| Updated September 12, 2020
Ohio COVID-19 Dashboard
A Simple, Client Side Tracking Dashboard for COVID-19 in Ohio
Posted November 28, 2019
RTK to WGS84
Transforming Coordinates with JavaScript using proj4.js
Posted November 17, 2019
Highlighting Features in Mapbox GL JS
A Comparison of Filter and Feature-State
Posted July 12, 2019
Network Tracing with Turf JS
A Client Side Solution for Simple Upstream and Downstream Linear Network Analysis
Posted May 10, 2019
Progressive Web Apps
Using PWA Components for Web Maps
Posted April 5, 2019
Open Parcel Viewer
A Client-Side Parcel Viewer built with Leaflet
Posted April 5, 2019
Leaflet Store Locator
A Leaflet Version of the Original Mapbox JS Store Locator Example
Posted September 9, 2018
Intro to Turf JS
Geospatial Analysis for the Browser, Desktop & Server
Posted February 12, 2018
| Updated April 11, 2019
Mapping with Vector Tiles
Query Features Outside the Viewport
Posted September 14, 2017
Data-Driven Styling, 3D Polygons & Vector Tiles with Mapbox GL JS
Posted May 16, 2017
Web Maps from Scratch
An Introduction to Leaflet, GitHub & Jekyll
Posted November 16, 2016
What is a Map?
Marshall Univerity 2016 GIS Day Keynote
Posted September 30, 2016
Beyond the Desktop
Open Source Experiments in Web Mapping
Posted August 13, 2016
Jekyll, Leaflet and TurfJS
Open Source Tools for Web Mapping
Posted January 24, 2016
Leaflet & GeoJson Tiles
A County Parcel App: No GIS Server? No Problem!
Posted December 18, 2015
CartoDB Visualizations
One Data Set Four Ways
Posted December 3, 2015
A Modern Leaflet Toolbar
Horizontal Toolbars in Leaflet
Posted October 12, 2015
| Updated April 9, 2019
Conkle's Hollow Fall Hike
Mapping GPS Tracks with Leaflet
Posted September 20, 2015
Intro to Leaflet
A Presentation for the 2015 Ohio GIS Conference
Posted July 13, 2015
| Updated October 27, 2018
Leaflet Photo Map
A Trip Out West circa 1985
Posted November 19, 2014
Hosting a GeoJson on GitHub