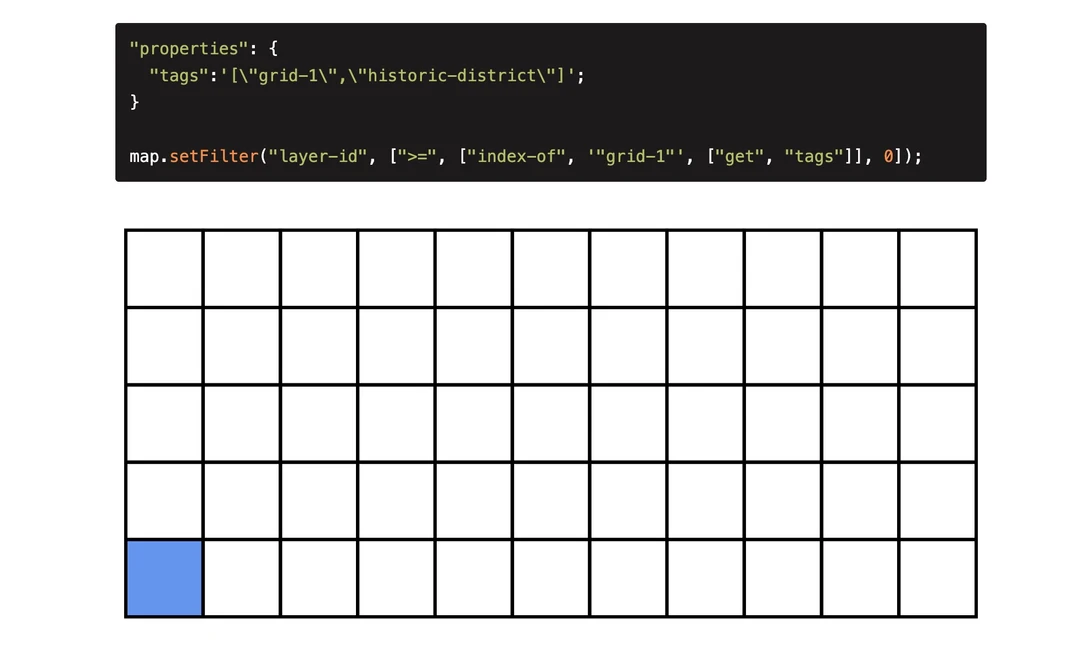
Filtering Arrays in MapLibre
Techniques for Substring Matching in MapLibre GL JS and Mapbox GL JS
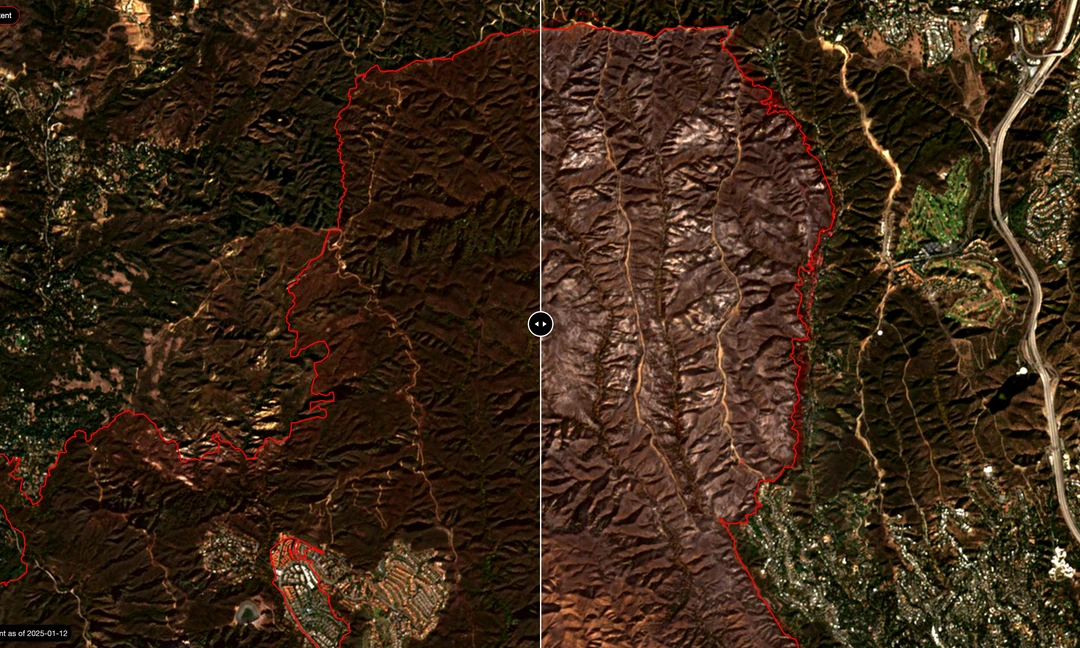
Palisades Fire Before and After
A Sample of Available Satellite Data for Post-Disaster Visual Assessment


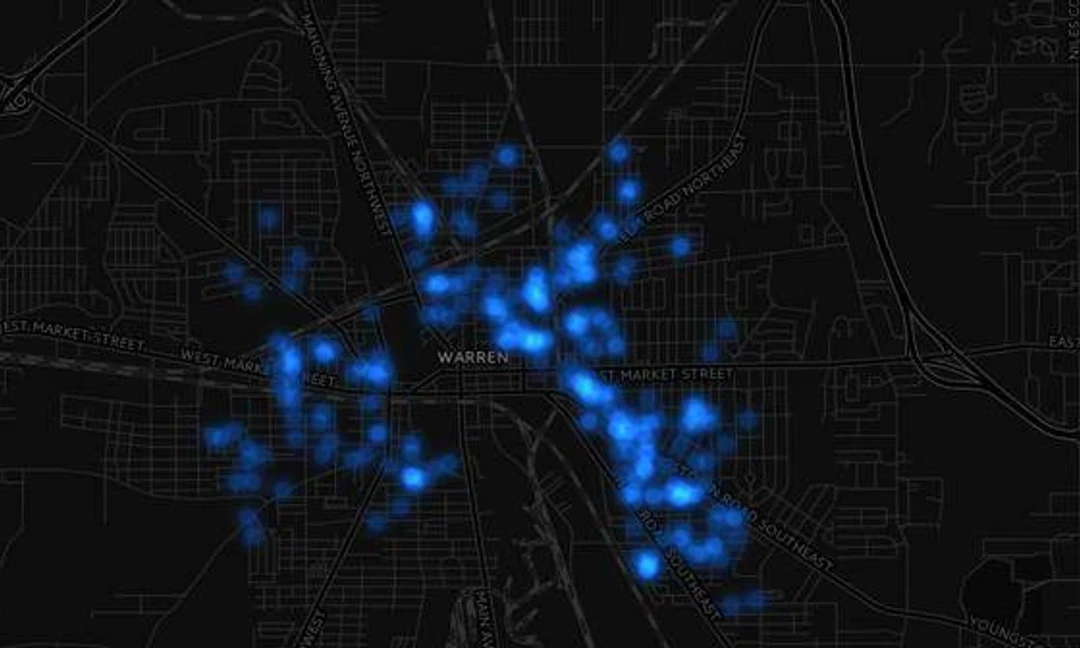
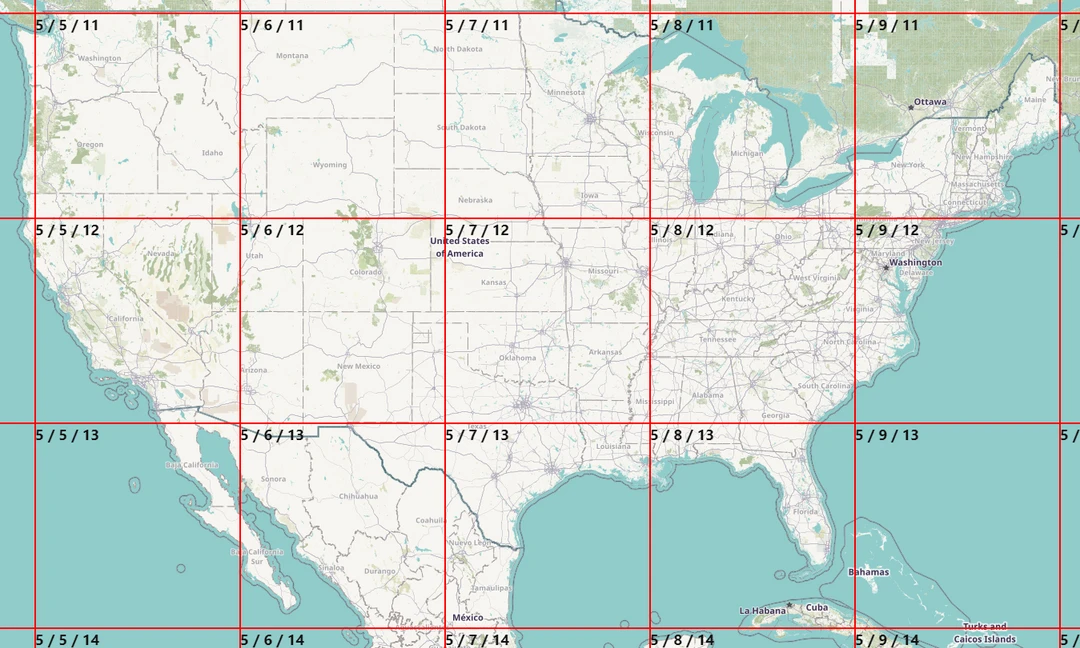
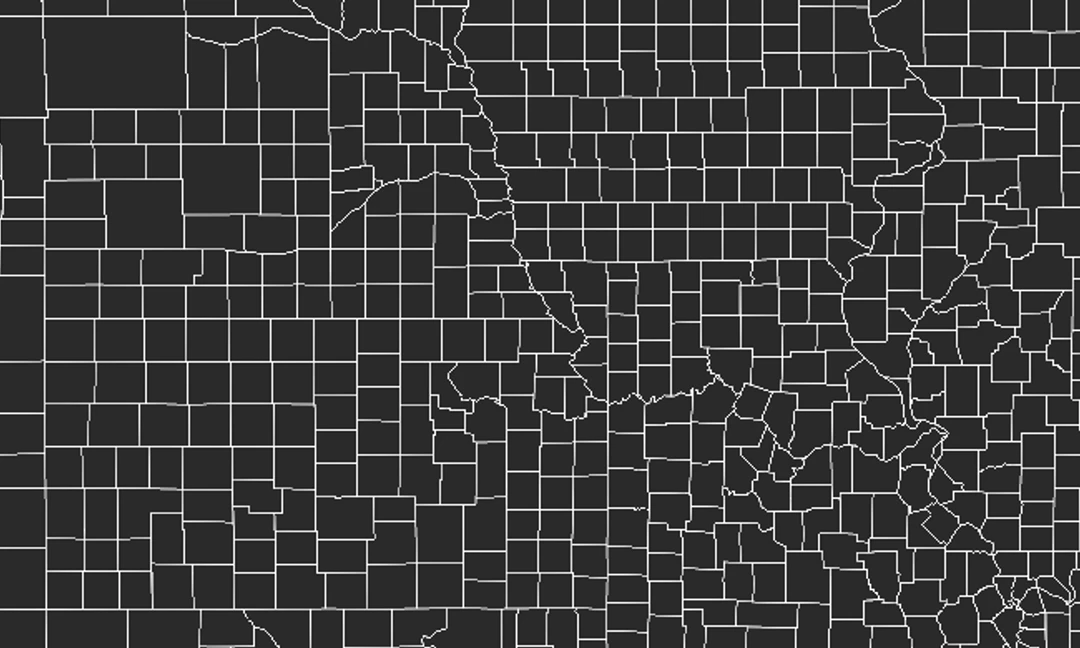
Serverless Web Maps
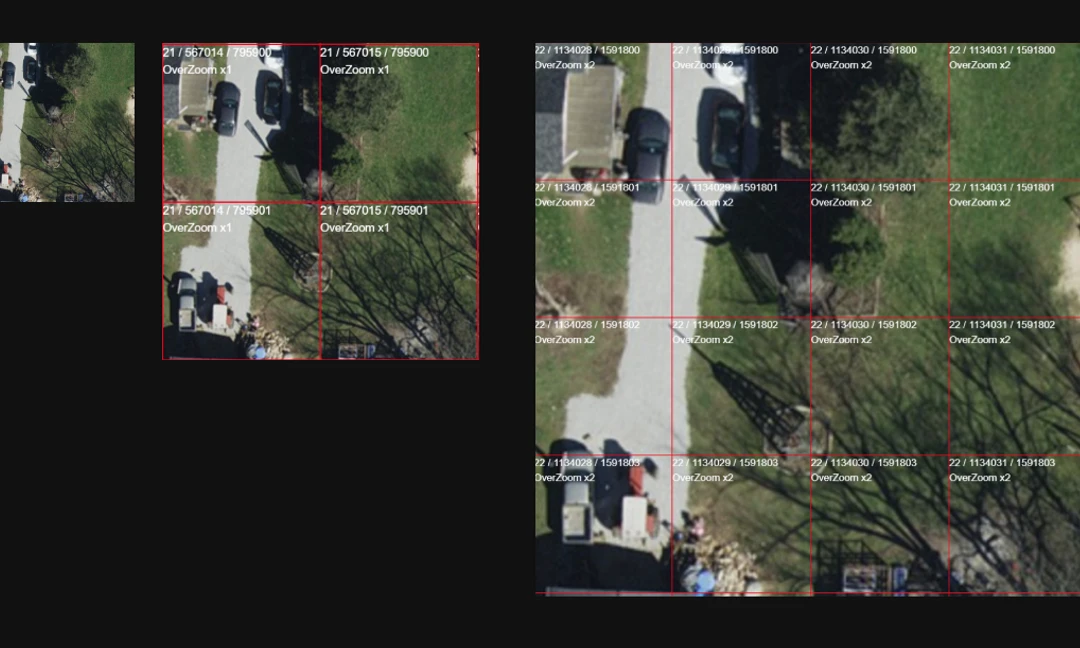
Using SQLite in the Browser and Service Workers to Power Web Maps from Object Storage
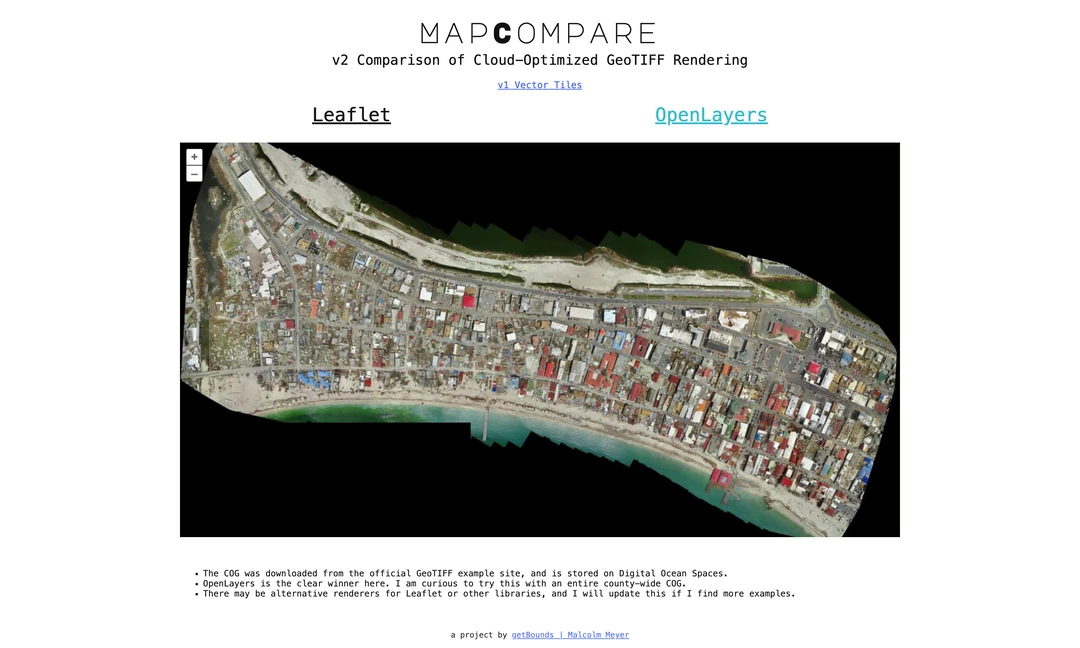
Generating Cloud Optimized GeoTIFFs and Raster Tiles with GDAL
TL;DR gdalbuildvrt, gdal_translate, gdal_warp and gdaladdo


Awesome Custom Print Maps
A curated listing of sites selling exclusively custom map-related products such as posters, mugs, 3D maps, etc.
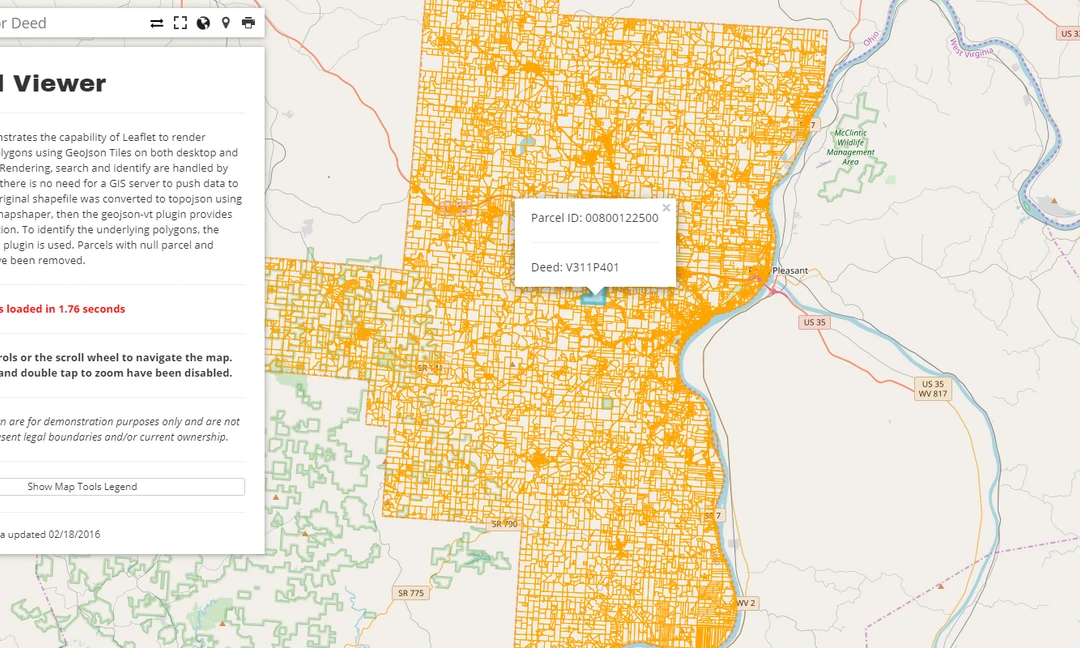
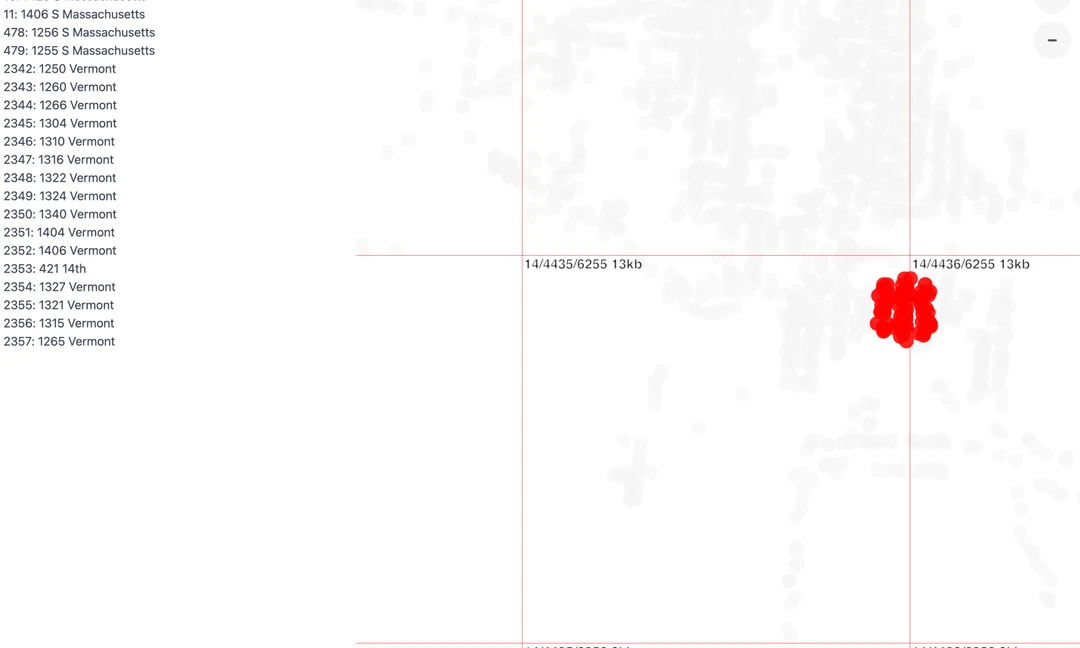
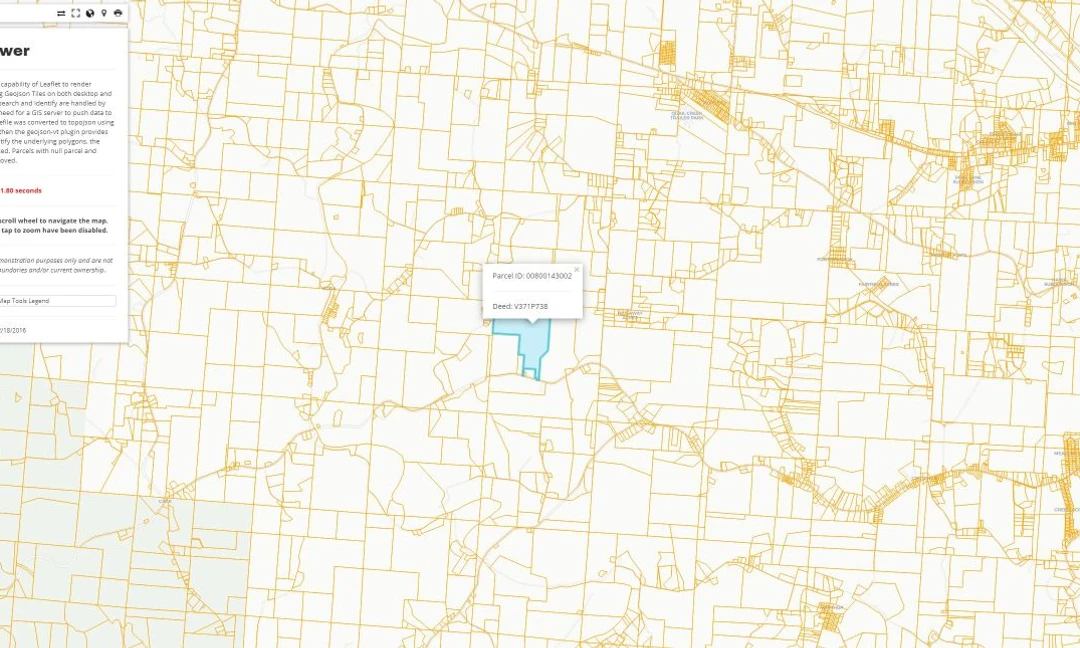
Exporting AGOL Feature Services to GeoJSON
Using NodeJS and Batches to Transform an ArcGIS Online Feature Service to GeoJSON
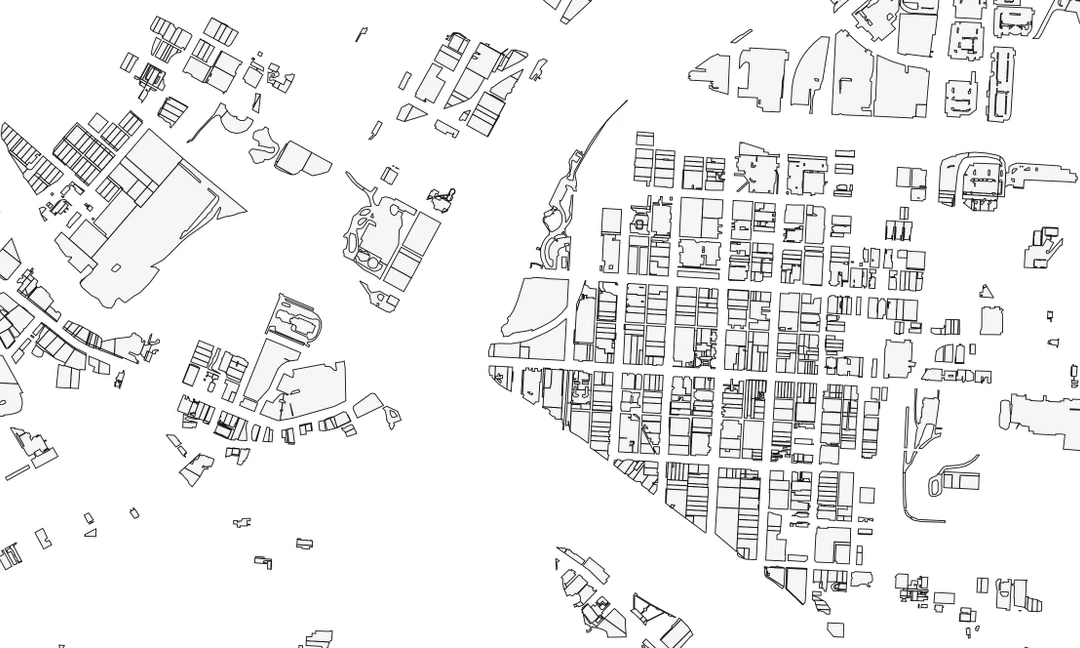
Agol Cache
A NodeJS script to download all layers within a public or protected ArcGIS Online Feature or Map Service as GeoJSON.

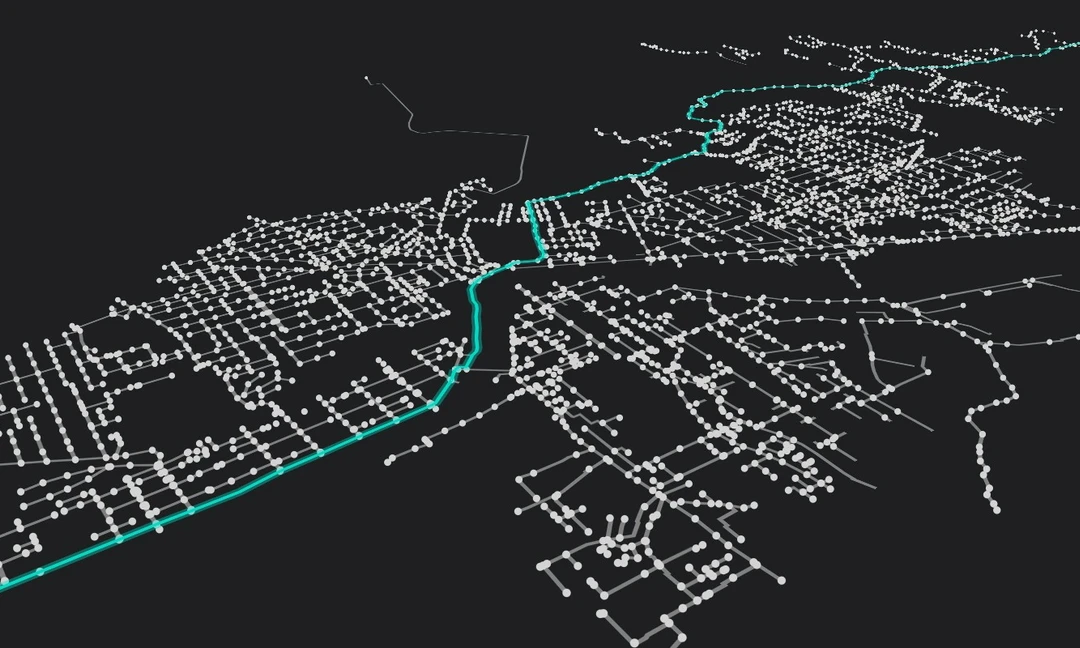
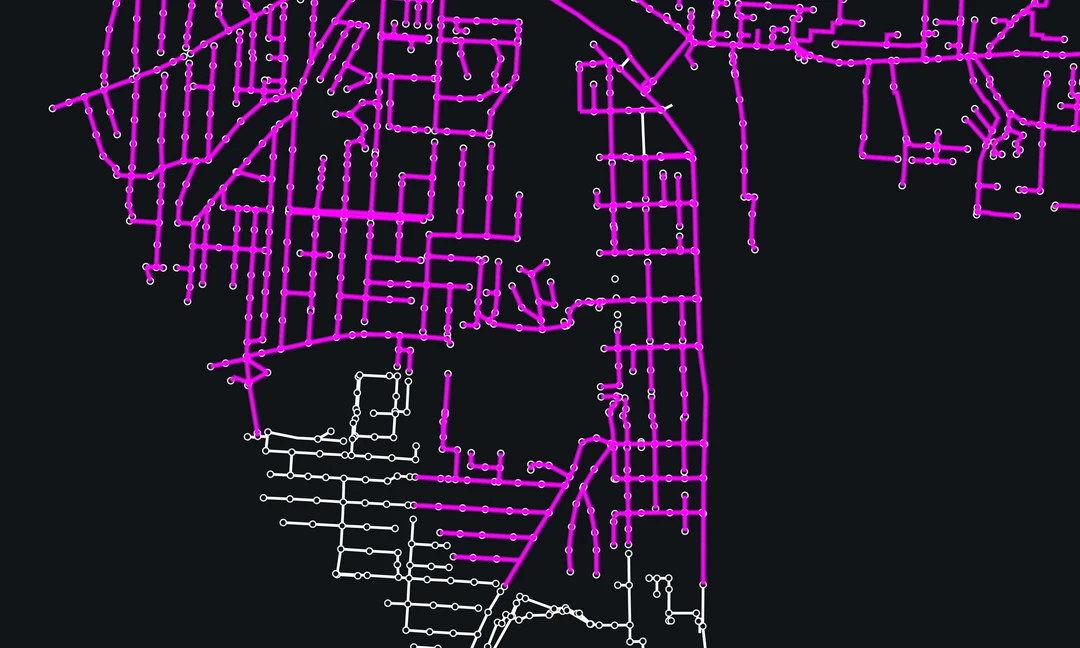
Network Tracing with Turf JS
A Client Side Solution for Simple Upstream and Downstream Linear Network Analysis
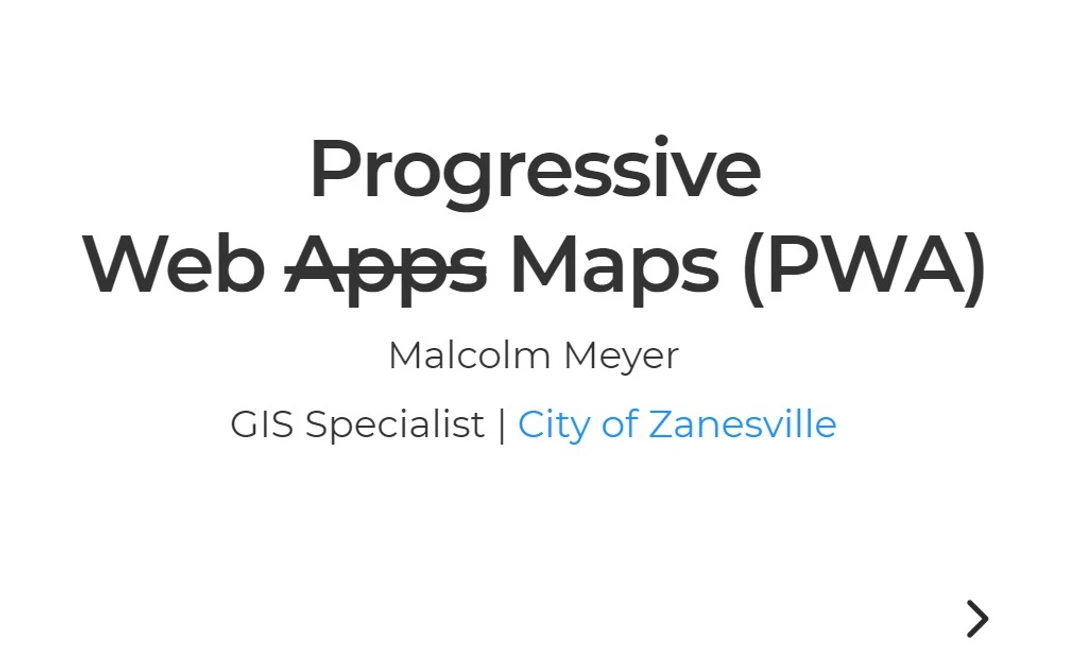
Pwa Maps
A presentation on using OpenMapTiles and service workers to turn an interactive map into an offline-capable Progressive Web App.


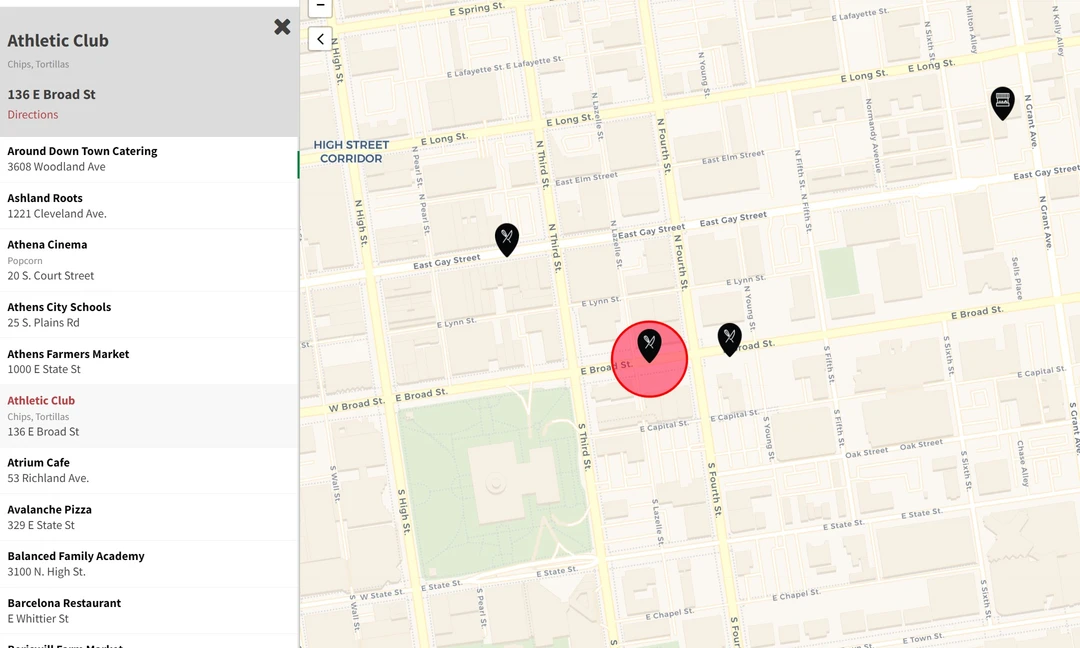
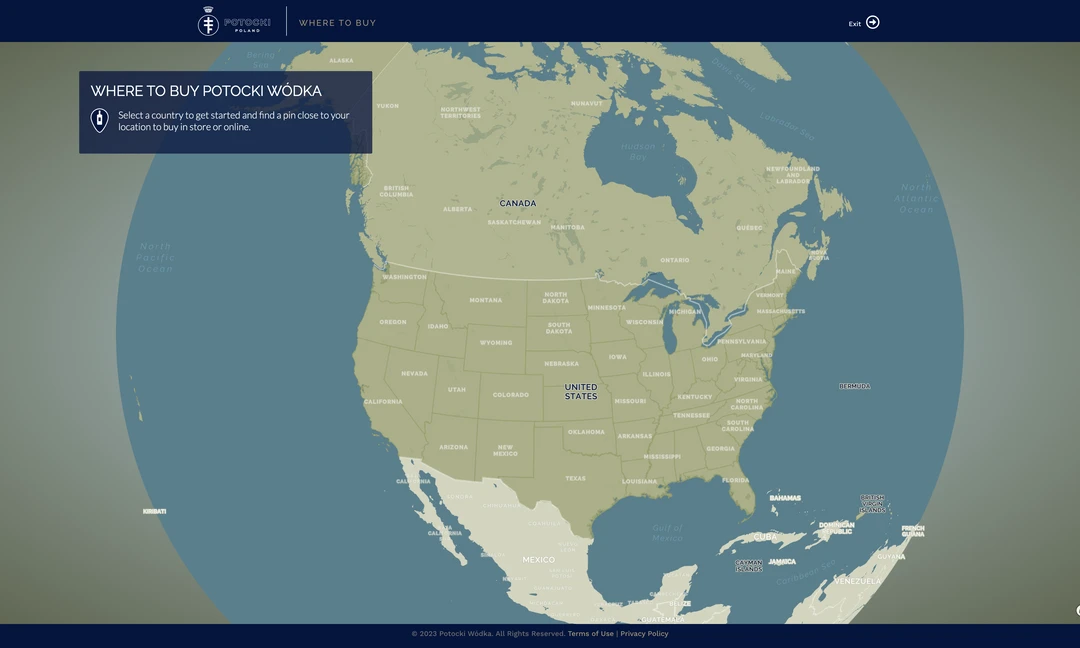
Leaflet Store Locator
A responsive open source store locator built with Leaflet and Bootstrap and based on the original Mapbox JS example.