Palisades Fire Before and After
A Sample of Available Satellite Data for Post-Disaster Visual Assessment
Inspired by this post on LinkedIn from Brianna R. Pagán, Ph.D., in which she describes the lack of available real-time satellite data during the 2025 Palisades Fire, I wanted to see what types of satellite data were available now, several days into the disaster. By January 16th, 2025, nine days after the start of the fire, data from several providers had been made available, including Sentinel-2, Umbra, and Maxar.
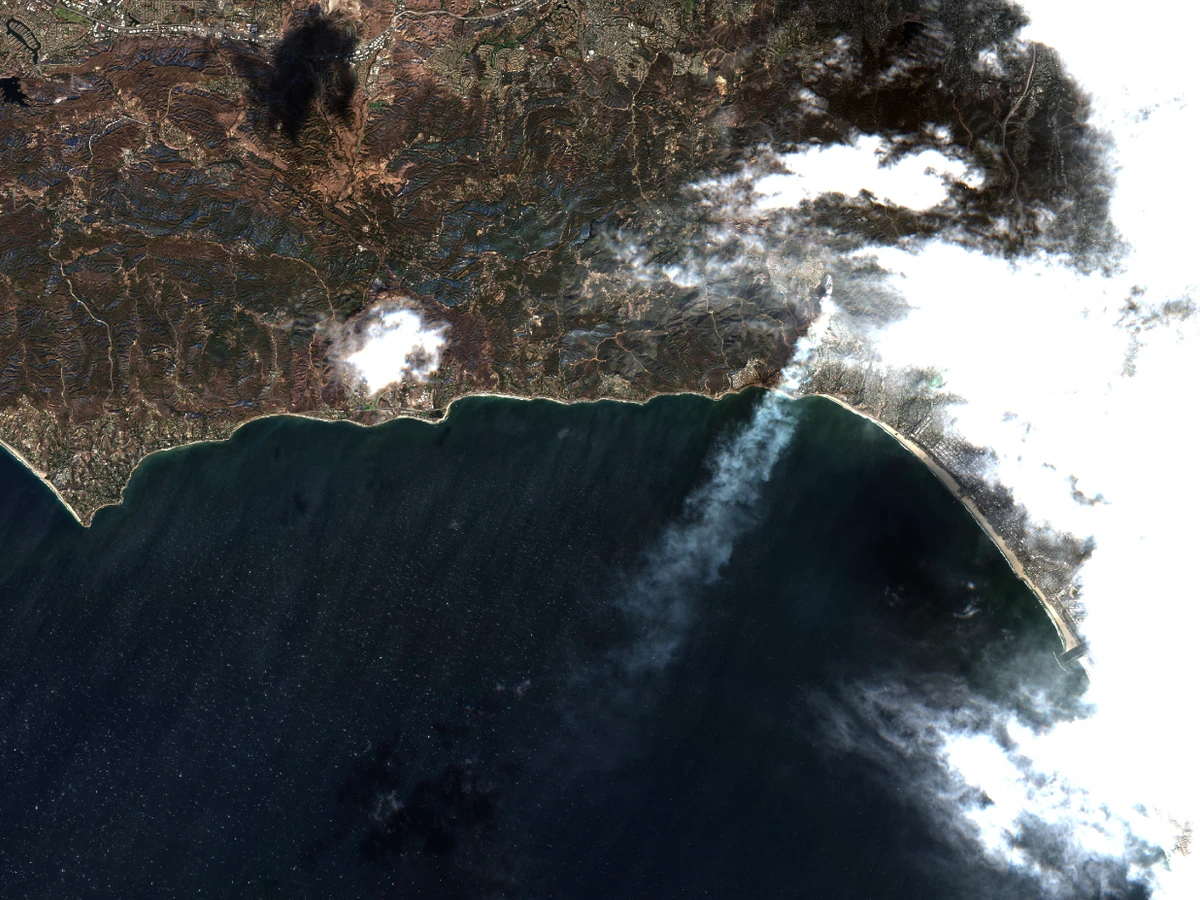
The map above shows two satellite imagery captures, January 2nd (left) and January 12th, 2025, from the Sentinel-2 satellite constellation. Comparing these two images, we can clearly see the deadly Palisades fire rapid expansion across the Santa Monica Mountains and into the Pacific Palisades neighborhood (map - bottom-right).
Sentinel-2 passes over the earth every five days, so it’s not a rapid source of information, but it can be very useful, especially depending on the timing of the image capture and the relevant events. However, some of these contain extensive cloud cover, such as the image below. The images chosen for the map contain less than 20% cloud cover - which omitted this image and pushed out the time frame between the images to ten instead of five.
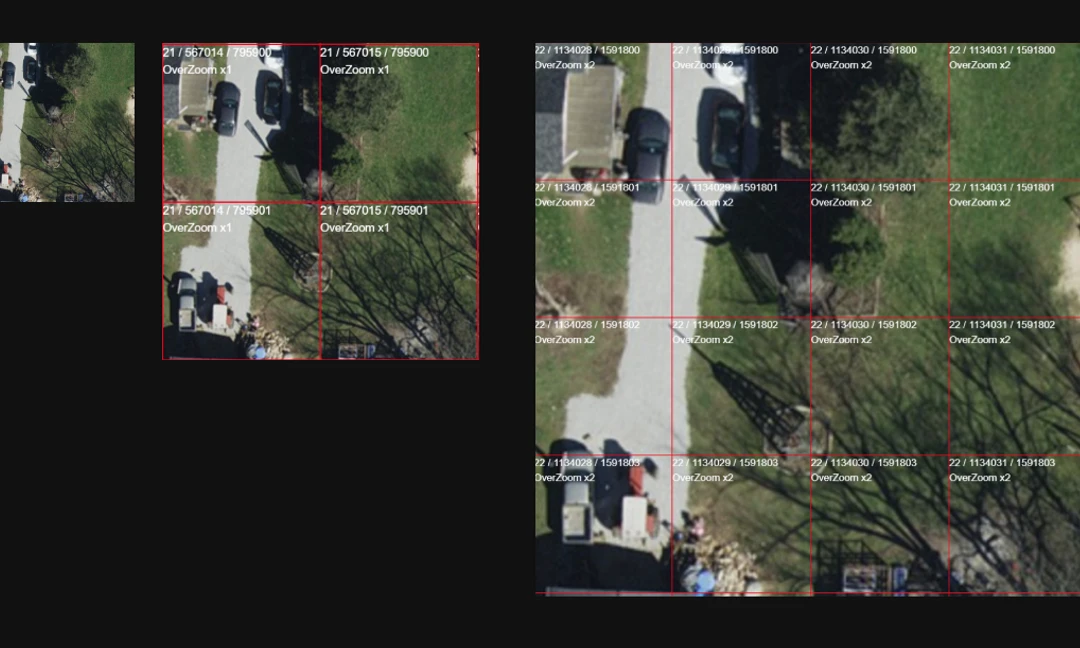
What’s missing in the Sentinel-2 data is the ability to quantify the impact across the urban infrastructure. Damage to individual buildings is hard to determine as the resolution is only 10 meters per pixel. Commercial satellites offer higher resolution data, and in this case the first available commercial data I came across was from Umbara and Maxar. Both companies added the wildfires to their open data programs, giving free access to their imagery over portions of the affected areas. You can find their latest imagery on their respective AWS Registry pages, as their own open data websites may not be up to date. And while this data is free to access, data licensing varies on the source which could limit the use of the data for commercial purposes.
Using this higher-resolution data, we can easily make out damage to individual structures. Visual assessment of the Maxar data is straightforward, with damage to homes clearly visible, but the Umbra data requires a bit more interpretation. The SAR data is represented as a grayscale image where pixel intensity corresponds to the strength of the radar signal (backscatter) returned to the satellite. In the image above, the static or fuzziness in the image represents increased backscatter, which could represent damage to the structures, while intact buildings are represented by a more seamless return. However, this is not a direct correlation, and further analysis would be needed to determine the extent of the damage.
Additionally, with the SAR image, you can see that the projection is slightly off, potentially due to the slant effect of the SAR method. This is my first time working with SAR data, so it’s not clear if the shift can be corrected with information from the metadata or if this is a limitation of the data itself. More information on Umbra deliverables can be found in the Canopy Documentation.
Finally, while you can task these commercial satellites multiple times per day, and in the case of Umbra they can give usable results even through cloud-cover, to cover an area as large as the Palisades Fire the cost could would be significant - in the thousands to hundreds of thousands of dollars depending on the area and resolution.
How I Built It
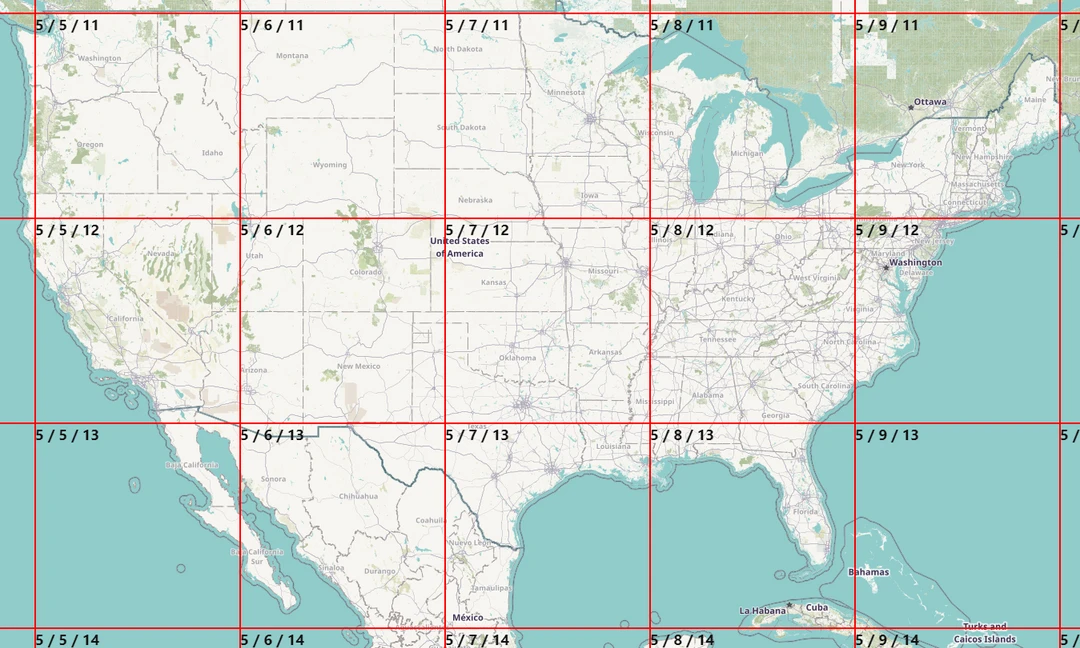
To create the first map above, I used data from the Sentinel-2 satellite constellation pulled from Element 84’s Earth Search Console. You can find the same imagery via SkyFi, which includes additional providers such as Umbra. If you are brave you can search the raw Spatio Temporal Asset catalogs (STAC) for each of these providers, but the process can be tedious. Once you find an image from the Earth Console, you need to view the image metadata to get the download link for the visual GeoTIFF asset.
|
Thanks to Geomatica and geotiff.js, we can add a cloud-optimized GeoTIFF directly into a MapLibre map. However, before we can use the Sentinel-2 imagery, we first need to convert it into a compatible compression format. The default compression used in the Sentinel-2 visual GeoTIFF imagery is DEFLATE, which is not supported by the browser. To convert the GeoTIFF into a compatible format, we can use gdal_translate from GDAL. For this visualization, I used a version of the script from my previous blog post on how to create cloud-optimized GeoTIFFs. After the conversion, I uploaded the GeoTIFFs to Cloudflare since the plugin allows for reading directly from object storage.
Once the images are converted, we can simply load them into the map and enable the swipe effect using the MapLibre Swipe Plugin.